前言
prometheus 监控的构建,相比 zabbix 来说,还是要麻烦一些。
当然,如果你完全熟悉之后,配置文件化也更容易被其他系统所修改。
监控端组件
搞之前,先创建一个网络
docker network create promsnet
Grafana 展示
https://grafana.com/docs/grafana/latest/installation/docker/
https://hub.docker.com/r/grafana/grafana
数据展示,部署在 proms 端
配置
/export/docker-data-grafana/conf/default.ini
主配置里参数非常多,修改下列基本配置即可
[server]
domain = 域名
http_port = 端口
[database]
type = sqlite3
host = 127.0.0.1:3306
name = grafana
user = root
password =
[smtp]
enabled = true
host = smtp.feishu.cn:465
user =
password =
skip_verify = true
from_address =
from_name = GrafanaAdmin
安装启动
versionTag=8.3.6
mkdir -p /export/docker-data-grafana/{data,conf}
chmod 777 /export/docker-data-grafana/data
docker run --name grafana \
--restart always \
--network promsnet \
--mount 'type=bind,src=/export/docker-data-grafana/data,dst=/var/lib/grafana' \
--mount 'type=bind,src=/export/docker-data-grafana/conf,dst=/usr/share/grafana/conf' \
-p 3000:3000 -d grafana/grafana:${versionTag}

cat << EOF | tee grafana.docker.command
docker run --name grafana \
--restart always \
--network promsnet \
--mount 'type=bind,src=/export/docker-data-grafana/data,dst=/var/lib/grafana' \
--mount 'type=bind,src=/export/docker-data-grafana/conf,dst=/usr/share/grafana/conf' \
-p 3000:3000 -d grafana/grafana:${versionTag}
EOF
正式版本号,纯数字,没有任何test或者pre后缀
默认账户/初始密码都是admin
默认配置库是sqlite 3
升级
dateTime=`date +%Y%m%d`
cp -rp /export/docker-data-grafana /export/docker-data-grafana.${dateTime}
Alertmanager 告警管理
告警管理器,接收 proms 发来的告警,经过【分组】=>【收敛】=>【静默】处理后通过【receiver】发出。
其配置中的标签可以是prometheus刮取数据中自带的,也可以是prometheus告警规则中自定义的labels。
告警分组、收敛、静默
分组的意思,就是将某一个组内同一时期的告警合并发送,例如根据实例来分组。
收敛的意思,就是告警A规则和告警B规则同时触发,但是告警A规则出现的时候,必然会触发告警B,此时只发告警A,例如MYSQL机器挂了,那么只需要发机器挂掉的告警,MYSQL的告警就没必要发送了。
静默的意思,就是用户已知这个时间点会触发告警规则,但是无需触发,例如高压力定时任务引起磁盘IO告警,虽然会触发平均指标告警,但是在用户认定的安全范围内,因而无需触发。
- 分组
在【route】根路由上通过【label】进行分组,同组的预警尽量一次性发出
route:
  group_by: ['alertname']  # 告警分组指标, 可以写多个,从而进一步分组。
  group_wait: 10s # 分组后,组内需告警的第一条规则需要在 10s 内等待其它可能的告警规则,等待结束后一次性发出。
  group_interval: 5m # 在发生告警后,同组内需告警的规则列表需要在 5m 内等待列表可能发生的变动,若有变化,则等待结束后再次发送。
  repeat_interval: 1h # 在发生告警后,同组需告警的规则列表若在 1h 内没有发生变化,则再次发送。
👀alertname标签指的是prometheus告警规则名称
根路由【route】之后,还可以继续通过子路由【routes】来将不同【label】的告警发送给不同的【receiver】。
- 收敛
举例说明:当主机挂了,此时只需要发送主机挂掉的预警,无需再发送因主机挂掉而产出的其它预警。
inhibit_rules:
  - source_matchers: [severity="critical"]
    target_matchers: [severity=~"error|warning"]
    equal: [cluster] # 针对包含 cluster 标签的告警
  - source_matchers: [severity="critical"]
    target_matchers: [severity=~"error|warning"]
    equal: [instance] # 针对包含 instance 标签的告警
  - source_matchers: [severity="error"]
    target_matchers: [severity="warning"]
    equal: [name] # 针对包含容器标签 name 的告警
source_matchers 列出匹配标签键值对的【需告警】规则;
target_matchers 列出匹配标签键值对的【无需告警】规则;
当 equal 的标签【同时】被 source_matchers 和 target_matchers 匹配的时候,inhibit_rule 规则生效。
- 静默
web控制台上配置。就是临时关闭发送。
- 接收者
【receiver】统一由【receivers】进行配置。
配置
https://github.com/prometheus/alertmanager/blob/main/doc/examples/simple.yml
alertmanager.yml
global:
  resolve_timeout: 5m
  smtp_smarthost: 'localhost:25'
  smtp_require_tls: true
  smtp_from: '[email protected]'
  smtp_auth_username: 'alertmanager'
  smtp_auth_password: 'password'
route:
  group_by: ['alertname']
  group_wait: 10s
  group_interval: 10s
  repeat_interval: 1h
  receiver: 'wechat'
  routes:
    - matchers:
        - app=~"app1|app2"
      receiver: email
      routes:
        - matchers:
            - severity="critical"
          receiver: wechat
receivers:
- name: 'wechat'
  wechat_configs:
  - corp_id: ''
    to_user: ''
    agent_id: ''
    api_secret: ''
    send_resolved: true
- name: 'email'
  email_configs:
  - to: <tmpl_string>
inhibit_rules:
  - source_matchers: [severity="critical"]
    target_matchers: [severity=~"error|warning"]
    equal: [cluster] # 针对包含 cluster 标签的告警
  - source_matchers: [severity="critical"]
    target_matchers: [severity=~"error|warning"]
    equal: [instance] # 针对包含 instance 标签的告警
  - source_matchers: [severity="error"]
    target_matchers: [severity="warning"]
    equal: [name] # 针对包含容器标签 name 的告警
上面是微信的,你也可以webhook方式,来走其它方式,例如飞书/钉钉
global:
  resolve_timeout: 5m
# 告警根路由
route:
  group_by: ['alertname']
  group_wait: 10s
  group_interval: 5m
  repeat_interval: 60m
  receiver: 'feishu'
# 默认的接收队列
receivers:
- name: 'feishu'
  webhook_configs:
  - url: ''
# 抑制规则
inhibit_rules:
  - source_matchers: [severity="critical"]
    target_matchers: [severity=~"error|warning"]
    equal: [cluster] # 针对包含 cluster 标签的告警
  - source_matchers: [severity="critical"]
    target_matchers: [severity=~"error|warning"]
    equal: [instance] # 针对包含 instance 标签的告警
  - source_matchers: [severity="error"]
    target_matchers: [severity="warning"]
    equal: [name] # 针对包含容器标签 name 的告警
告警发送中心
💁关于飞书/钉钉的webhook,可以用部署 PrometheusAlert实现。
https://feiyu563.gitbook.io/prometheusalert/webhook
贴一个PrometheusAlert的告警模板:
{{ $var := .externalURL}}{{ range $k,$v:=.alerts }}
{{if eq $v.status "resolved"}}
**Prometheus恢复信息**
告警项目:{{$v.labels.alertname}}
告警级别:{{$v.labels.severity}}
持续范围:{{GetCSTtime $v.startsAt}} to {{GetCSTtime $v.endsAt}}
故障主机:{{$v.labels.instance}}
**{{$v.annotations.summary}}**
[点击打开grafana]({{$v.annotations.grafana}})
{{else}}
**Prometheus告警信息**
告警项目:{{$v.labels.alertname}}
告警级别:{{$v.labels.severity}}
开始时间:{{GetCSTtime $v.startsAt}}
故障主机:{{$v.labels.instance}}
**{{$v.annotations.summary}}**
[点击打开grafana]({{$v.annotations.grafana}})
{{end}}
{{ end }}
👀GetCSTtime是PrometheusAlert自带的一个方法,可以将时区转换成CST。
从Alertmanager发过来的消息例子,可用于在PrometheusAlert中测试模板。
{"receiver":"web\\.hook\\.prometheusalert","status":"resolved","alerts":[{"status":"resolved","labels":{"alertname":"container-cpu-usage-high","cpu":"cpu00","desc":"容器的cpu总消耗百分比","id":"/docker/91afdbd4c24f22650ce","image":"registry-vpc.cn-zhangjiakou.aliyuncs.com/zyh/app1:latest","instance":"java001.zjk.zyh","job":"auto_discovery_dns","name":"app1","severity":"warning","unit":"%"},"annotations":{"grafana":"http://<grafana_ip>","id":"","summary":"instance: java001.zjk.zyh 下的 container: app1 cpu 使用率持续超过90%."},"startsAt":"2022-02-17T18:06:40.611569268Z","endsAt":"2022-02-17T18:06:55.611569268Z","generatorURL":"http://<prometheus_ip>:9090","fingerprint":"d48ec3"}],"groupLabels":{"alertname":"container-cpu-usage-high"},"commonLabels":{"alertname":"container-cpu-usage-high","cpu":"cpu00","desc":"容器的cpu总消耗百分比","id":"/docker/91afdbd4c24f22650ce","image":"registry-vpc.cn-zhangjiakou.aliyuncs.com/zyh/app1:latest","instance":"java001.zjk.zyh","job":"auto_discovery_dns","name":"cms-runner","severity":"warning","unit":"%"},"commonAnnotations":{"grafana":"http://<grafana_ip>","id":"","summary":"instance: java001.zjk.zyh 下的 container: app1 cpu 使用率持续超过90%."},"externalURL":"http://e21437fd4:9093","version":"4","groupKey":"{}:{alertname=\"container-cpu-usage-high\"}","truncatedAlerts":0}
官方列出的POST json数据:
{
  "version": "4",
  "groupKey": <string>,              // key identifying the group of alerts (e.g. to deduplicate)
  "truncatedAlerts": <int>,          // how many alerts have been truncated due to "max_alerts"
  "status": "<resolved|firing>",
  "receiver": <string>,
  "groupLabels": <object>,
  "commonLabels": <object>,
  "commonAnnotations": <object>,
  "externalURL": <string>,           // backlink to the Alertmanager.
  "alerts": [
    {
      "status": "<resolved|firing>",
      "labels": <object>,
      "annotations": <object>,
      "startsAt": "<rfc3339>",
      "endsAt": "<rfc3339>",
      "generatorURL": <string>,      // identifies the entity that caused the alert
      "fingerprint": <string>        // fingerprint to identify the alert
    },
    ...
  ]
}
启动
mkdir -p /export/docker-data-alertmanager
docker run --name alertmanager -d \
  --restart always \
  --network promsnet \
  -p 9093:9093 \
  --mount 'type=bind,src=/export/docker-data-alertmanager,dst=/etc/alertmanager' \
  prom/alertmanager
Prometheus 主程
概念
- 数据来源:
- 从各种源服务自带的 /metrics 地址中获取指标数据;
- 如果源服务(例如redis)里没有提供,则可以从第三方写好的抓取服务中获取指标数据;
- 如果是自己写的服务,则可以在服务里嵌入 prometheus 的 sdk 来暴漏指标。
- 数据存储:
- 默认是本地存储
- 可以是远程存储
mkdir /export/docker-data-proms/{data,conf} -p
chmod 777 /export/docker-data-proms/data
配置
主配置
/export/docker-data-proms/promethesu.yml
# my global config
global:
  scrape_interval:     15s # 从数据源处刮取数据的间隔周期。默认是1分钟
  evaluation_interval: 15s # 重新评估告警表达式的间隔周期。默认是1分钟
  # scrape_timeout is set to the global default (10s).

# Alertmanager configuration
alerting:
  alertmanagers:
  - static_configs:
    - targets:
      - alertmanager:9093

# Load rules once and periodically evaluate them according to the global 'evaluation_interval'.
rule_files:
  - "/etc/prometheus/conf/rules/*.yml"

# A scrape configuration containing exactly one endpoint to scrape:
# Here it's Prometheus itself.
scrape_configs:
  # The job name is added as a label `job=<job_name>` to any timeseries scraped from this config.
#  - job_name: 'prometheus'
#    static_configs:
#    - targets: ['proms:9090']

#  - job_name: "grafana"
#    static_configs:
#    - targets: ['grafana:3000']

  - job_name: "auto_discovery_dns"
    relabel_configs: # 数据获取之前,针对数据源 target 的标签修改
    - source_labels: ["__address__"]  # 将 target 中标签键 __address__ = (.*):9100 变更为 instance = .*
      regex: "(.*):9100" # 匹配原始标签的值
      replacement: "$1" # 提取 regex 中拿到的值
      target_label: "instance" # 设定要修改的目标标签
      action: replace # 将目标标签的值替换为 replacement 提取的值
    - source_labels: ["__address__"]  # 获取原始标签
      regex: "(.*):10052" # 匹配原始标签的值
      replacement: "$1" # 提取 regex 中拿到的值
      target_label: "instance" # 设定要修改的目标标签
      action: replace # 将目标标签的值替换为 replacement 提取的值
    metric_relabel_configs: # 数据获取后,针对数据指标落盘前的修改
    - source_labels: ["__name__"] # 获取原始标签
      regex: "^go_.*|^process_.*" # 匹配标签值
      action: drop # 删除,不让数据落盘
    dns_sd_configs: # 通过 dns srv 记录自动发现
    - names: ["_prometheus._tcp.zjk.pj"]

# 启用远程存储 TSDB,以阿里云的 TSDB mlarge 规格数据库为例
# 阿里云的 TSDB 推荐配置表: https://help.aliyun.com/document_detail/114516.html
## Remote write configuration (TSDB).
remote_write:
  - url: "http://ts-xxxxxxxxxxxx.hitsdb.rds.aliyuncs.com:3242/api/prom_write"
    # Configures the queue used to write to remote storage.
    queue_config:
      # Number of samples to buffer per shard before we start dropping them. 内存事件队列长度,如果满了,则新事件直接丢弃
      capacity: 10000
      # Maximum number of shards, i.e. amount of concurrency. 并发 shard 数
      max_shards: 1
      # Maximum number of samples per send. 每个 shard 每次发送多少事件。以500为例,可以简单的理解为每秒发送5000
      max_samples_per_send: 500

## Remote read configuration (TSDB).
remote_read:
  - url: "http://ts-xxxxxxxxxxxx.hitsdb.rds.aliyuncs.com:3242/api/prom_read"
    read_recent: true
relabel_configs:针对 scrape target endpoint(刮取器) 的标签修改
metric_relabel_configs:针对 scrape target endpoint 拿到的 metrics 指标数据的标签修改
__name__是内置的针对标签键的通用名
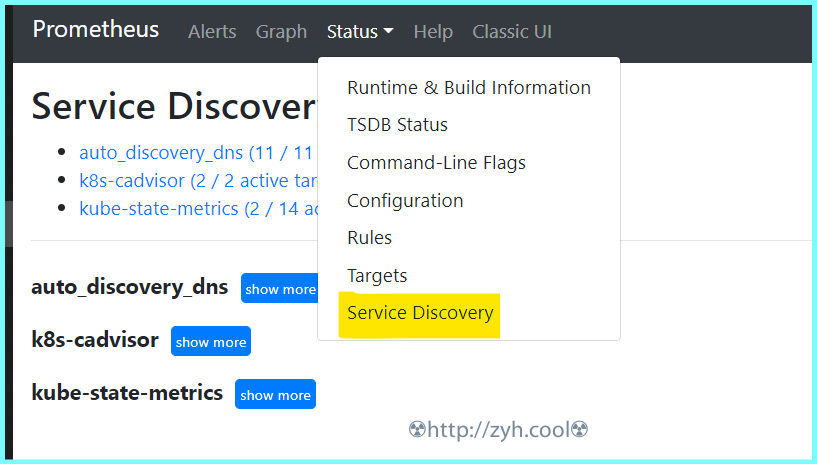
原始标签和目标标签
可以在下图位置【Status】-【Service Discovery】中看到详情
自动发现
dns srv 自动发现,需要一个内部的dns服务器,例如阿里云的云私有解析等。
如何添加 srv 记录,例如让proms发现节点服务 all.it.zjk.pj:9100 和 all.it.zjk.pj:10052
- 添加私有域 zjk.pj
- 添加A记录 all.it.zjk.pj -> 192.168.1.1
- 添加srv记录 _prometheus._tcp.zjk.pj -> 10 10 9100 all.it.zjk.pj
- 添加srv记录 _prometheus._tcp.zjk.pj -> 10 10 10052 all.it.zjk.pj
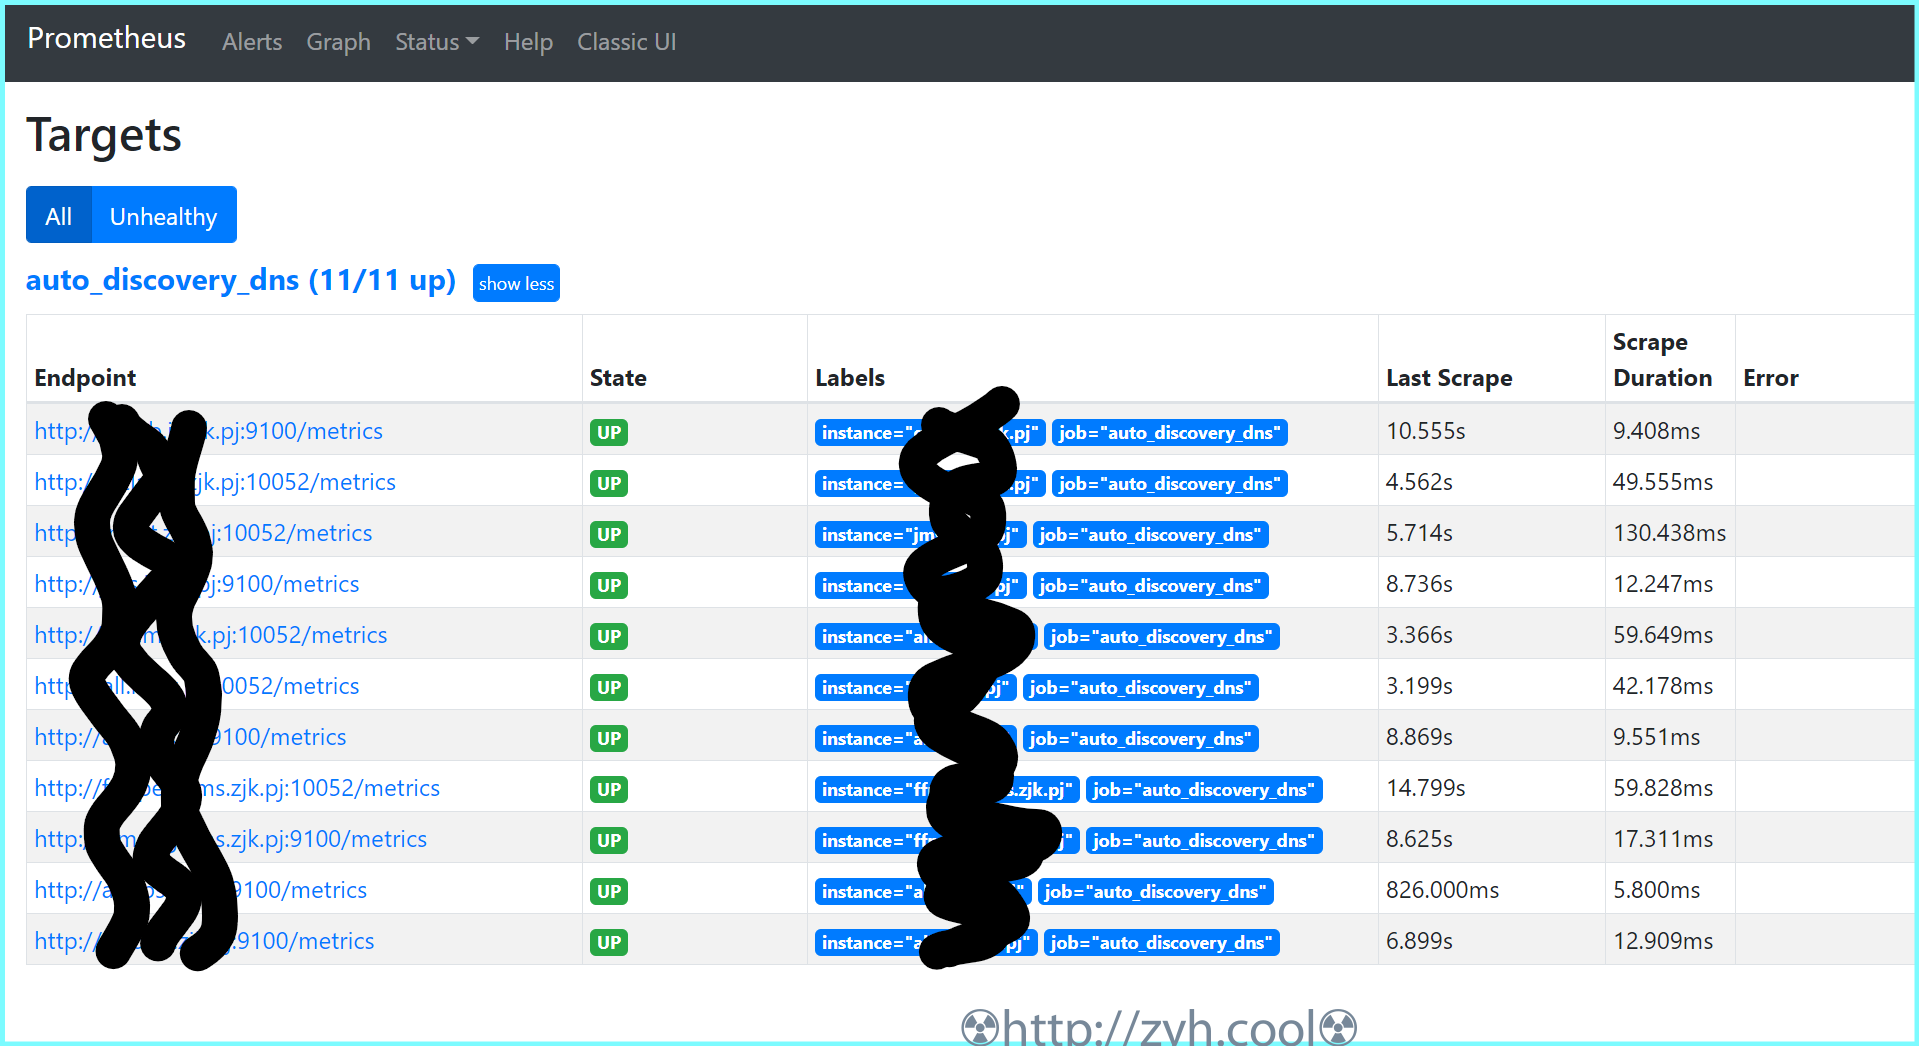
关于A记录就不说了,srv记录里 10 10 9100 all.it.zjk.pj的意思是优先级 权重 服务端口 服务器域名
最终,你可以在 http://<prometheus_ip>:9090/classic/targets 看到自动发现的节点信息。
定义需要告警的指标规则
将采集的数据指标通过 expr 进行运算,并通过 record 进行命名。
关于规则里的表达式语句的写法涉及到 PromQL,可以看一下文档。
https://fuckcloudnative.io/prometheus/3-prometheus/basics.html
主机监控指标规则
/export/docker-data-proms/conf/rules/node-exporter-record-rules.yml
# node-exporter-record-rules.yml
# 标签 job 关联主配置定义的任务 auto_discovery_dns,获取任务传递的数据,从而抽取信息定义 expr
# 给 expr 表达式设置一个别名 record, 别名可以被其它 rules 调用

groups:
  - name: node_exporter-record
    rules:
    - expr: up{job=~"auto_discovery_dns"}* on(instance) group_left(nodename) (node_uname_info)
      record: node_exporter:up
      labels:
        desc: "节点是否在线, 在线1,不在线0"
        unit: " "
        job: "auto_discovery_dns"
    - expr: time() - node_boot_time_seconds{}* on(instance) group_left(nodename) (node_uname_info)
      record: node_exporter:node_uptime
      labels:
        desc: "节点的运行时间"
        unit: "s"
        job: "auto_discovery_dns"
##############################################################################################
#                              cpu                                                           #
    - expr: (1 - avg by (environment,instance) (irate(node_cpu_seconds_total{job="auto_discovery_dns",mode="idle"}[5m])))  * 100 * on(instance) group_left(nodename) (node_uname_info)
      record: node_exporter:cpu:total:percent
      labels:
        desc: "节点的cpu总消耗百分比"
        unit: "%"
        job: "auto_discovery_dns"

    - expr: (avg by (environment,instance) (irate(node_cpu_seconds_total{job="auto_discovery_dns",mode="idle"}[5m])))  * 100 * on(instance) group_left(nodename) (node_uname_info)
      record: node_exporter:cpu:idle:percent
      labels:
        desc: "节点的cpu idle百分比"
        unit: "%"
        job: "auto_discovery_dns"

    - expr: (avg by (environment,instance) (irate(node_cpu_seconds_total{job="auto_discovery_dns",mode="iowait"}[5m])))  * 100 * on(instance) group_left(nodename) (node_uname_info)
      record: node_exporter:cpu:iowait:percent
      labels:
        desc: "节点的cpu iowait百分比"
        unit: "%"
        job: "auto_discovery_dns"


    - expr: (avg by (environment,instance) (irate(node_cpu_seconds_total{job="auto_discovery_dns",mode="system"}[5m])))  * 100 * on(instance) group_left(nodename) (node_uname_info)
      record: node_exporter:cpu:system:percent
      labels:
        desc: "节点的cpu system百分比"
        unit: "%"
        job: "auto_discovery_dns"

    - expr: (avg by (environment,instance) (irate(node_cpu_seconds_total{job="auto_discovery_dns",mode="user"}[5m])))  * 100 * on(instance) group_left(nodename) (node_uname_info)
      record: node_exporter:cpu:user:percent
      labels:
        desc: "节点的cpu user百分比"
        unit: "%"
        job: "auto_discovery_dns"

    - expr: (avg by (environment,instance) (irate(node_cpu_seconds_total{job="auto_discovery_dns",mode=~"softirq|nice|irq|steal"}[5m])))  * 100 * on(instance) group_left(nodename) (node_uname_info)
      record: node_exporter:cpu:other:percent
      labels:
        desc: "节点的cpu 其他的百分比"
        unit: "%"
        job: "auto_discovery_dns"
##############################################################################################
#                                    memory                                                  #
    - expr: node_memory_MemTotal_bytes{job="auto_discovery_dns"}* on(instance) group_left(nodename) (node_uname_info)
      record: node_exporter:memory:total
      labels:
        desc: "节点的内存总量"
        unit: byte
        job: "auto_discovery_dns"

    - expr: node_memory_MemFree_bytes{job="auto_discovery_dns"}* on(instance) group_left(nodename) (node_uname_info)
      record: node_exporter:memory:free
      labels:
        desc: "节点的剩余内存量"
        unit: byte
        job: "auto_discovery_dns"

    - expr: node_memory_MemTotal_bytes{job="auto_discovery_dns"} - node_memory_MemFree_bytes{job="auto_discovery_dns"}* on(instance) group_left(nodename) (node_uname_info)
      record: node_exporter:memory:used
      labels:
        desc: "节点的已使用内存量"
        unit: byte
        job: "auto_discovery_dns"

    - expr: node_memory_MemTotal_bytes{job="auto_discovery_dns"} - node_memory_MemAvailable_bytes{job="auto_discovery_dns"}* on(instance) group_left(nodename) (node_uname_info)
      record: node_exporter:memory:actualused
      labels:
        desc: "节点用户实际使用的内存量"
        unit: byte
        job: "auto_discovery_dns"

    - expr: (1-(node_memory_MemAvailable_bytes{job="auto_discovery_dns"} / (node_memory_MemTotal_bytes{job="auto_discovery_dns"})))* 100* on(instance) group_left(nodename) (node_uname_info)
      record: node_exporter:memory:used:percent
      labels:
        desc: "节点的内存使用百分比"
        unit: "%"
        job: "auto_discovery_dns"

    - expr: ((node_memory_MemAvailable_bytes{job="auto_discovery_dns"} / (node_memory_MemTotal_bytes{job="auto_discovery_dns"})))* 100* on(instance) group_left(nodename) (node_uname_info)
      record: node_exporter:memory:free:percent
      labels:
        desc: "节点的内存剩余百分比"
        unit: "%"
        job: "auto_discovery_dns"
##############################################################################################
#                                   load                                                     #
    - expr: sum by (instance) (node_load1{job="auto_discovery_dns"})* on(instance) group_left(nodename) (node_uname_info)
      record: node_exporter:load:load1
      labels:
        desc: "系统1分钟负载"
        unit: " "
        job: "auto_discovery_dns"

    - expr: sum by (instance) (node_load5{job="auto_discovery_dns"})* on(instance) group_left(nodename) (node_uname_info)
      record: node_exporter:load:load5
      labels:
        desc: "系统5分钟负载"
        unit: " "
        job: "auto_discovery_dns"

    - expr: sum by (instance) (node_load15{job="auto_discovery_dns"})* on(instance) group_left(nodename) (node_uname_info)
      record: node_exporter:load:load15
      labels:
        desc: "系统15分钟负载"
        unit: " "
        job: "auto_discovery_dns"

##############################################################################################
#                                 disk                                                       #
    - expr: node_filesystem_size_bytes{job="auto_discovery_dns" ,fstype=~"ext4|xfs"}* on(instance) group_left(nodename) (node_uname_info)
      record: node_exporter:disk:usage:total
      labels:
        desc: "节点的磁盘总量"
        unit: byte
        job: "auto_discovery_dns"

    - expr: node_filesystem_avail_bytes{job="auto_discovery_dns",fstype=~"ext4|xfs"}* on(instance) group_left(nodename) (node_uname_info)
      record: node_exporter:disk:usage:free
      labels:
        desc: "节点的磁盘剩余空间"
        unit: byte
        job: "auto_discovery_dns"

    - expr: node_filesystem_size_bytes{job="auto_discovery_dns",fstype=~"ext4|xfs"} - node_filesystem_avail_bytes{job="auto_discovery_dns",fstype=~"ext4|xfs"}* on(instance) group_left(nodename) (node_uname_info)
      record: node_exporter:disk:usage:used
      labels:
        desc: "节点的磁盘使用的空间"
        unit: byte
        job: "auto_discovery_dns"

    - expr:  (1 - node_filesystem_avail_bytes{job="auto_discovery_dns",fstype=~"ext4|xfs"} / node_filesystem_size_bytes{job="auto_discovery_dns",fstype=~"ext4|xfs"}) * 100 * on(instance) group_left(nodename) (node_uname_info)
      record: node_exporter:disk:used:percent
      labels:
        desc: "节点的磁盘的使用百分比"
        unit: "%"
        job: "auto_discovery_dns"

    - expr: irate(node_disk_reads_completed_total{job="auto_discovery_dns"}[1m])* on(instance) group_left(nodename) (node_uname_info)
      record: node_exporter:disk:read:count:rate
      labels:
        desc: "节点的磁盘读取速率"
        unit: "次/秒"
        job: "auto_discovery_dns"

    - expr: irate(node_disk_writes_completed_total{job="auto_discovery_dns"}[1m])* on(instance) group_left(nodename) (node_uname_info)
      record: node_exporter:disk:write:count:rate
      labels:
        desc: "节点的磁盘写入速率"
        unit: "次/秒"
        job: "auto_discovery_dns"

    - expr: (irate(node_disk_written_bytes_total{job="auto_discovery_dns"}[1m]))/1024/1024* on(instance) group_left(nodename) (node_uname_info)
      record: node_exporter:disk:read:mb:rate
      labels:
        desc: "节点的设备读取MB速率"
        unit: "MB/s"
        job: "auto_discovery_dns"

    - expr: (irate(node_disk_read_bytes_total{job="auto_discovery_dns"}[1m]))/1024/1024* on(instance) group_left(nodename) (node_uname_info)
      record: node_exporter:disk:write:mb:rate
      labels:
        desc: "节点的设备写入MB速率"
        unit: "MB/s"
        job: "auto_discovery_dns"

##############################################################################################
#                                filesystem                                                  #
    - expr:   (1 -node_filesystem_files_free{job="auto_discovery_dns",fstype=~"ext4|xfs"} / node_filesystem_files{job="auto_discovery_dns",fstype=~"ext4|xfs"}) * 100 * on(instance) group_left(nodename) (node_uname_info)
      record: node_exporter:filesystem:used:percent
      labels:
        desc: "节点的inode的剩余可用的百分比"
        unit: "%"
        job: "auto_discovery_dns"
#############################################################################################
#                                filefd                                                     #
    - expr: node_filefd_allocated{job="auto_discovery_dns"}* on(instance) group_left(nodename) (node_uname_info)
      record: node_exporter:filefd_allocated:count
      labels:
        desc: "节点的文件描述符打开个数"
        unit: "%"
        job: "auto_discovery_dns"

    - expr: node_filefd_allocated{job="auto_discovery_dns"}/node_filefd_maximum{job="auto_discovery_dns"} * 100 * on(instance) group_left(nodename) (node_uname_info)
      record: node_exporter:filefd_allocated:percent
      labels:
        desc: "节点的文件描述符打开百分比"
        unit: "%"
        job: "auto_discovery_dns"

#############################################################################################
#                                network                                                    #
    - expr: avg by (environment,instance,device) (irate(node_network_receive_bytes_total{device=~"eth0|eth1|ens33|ens37"}[1m]))* on(instance) group_left(nodename) (node_uname_info)
      record: node_exporter:network:netin:bit:rate
      labels:
        desc: "节点网卡eth0每秒接收的比特数"
        unit: "bit/s"
        job: "auto_discovery_dns"

    - expr: avg by (environment,instance,device) (irate(node_network_transmit_bytes_total{device=~"eth0|eth1|ens33|ens37"}[1m]))* on(instance) group_left(nodename) (node_uname_info)
      record: node_exporter:network:netout:bit:rate
      labels:
        desc: "节点网卡eth0每秒发送的比特数"
        unit: "bit/s"
        job: "auto_discovery_dns"

    - expr: avg by (environment,instance,device) (irate(node_network_receive_packets_total{device=~"eth0|eth1|ens33|ens37"}[1m]))* on(instance) group_left(nodename) (node_uname_info)
      record: node_exporter:network:netin:packet:rate
      labels:
        desc: "节点网卡每秒接收的数据包个数"
        unit: "个/秒"
        job: "auto_discovery_dns"

    - expr: avg by (environment,instance,device) (irate(node_network_transmit_packets_total{device=~"eth0|eth1|ens33|ens37"}[1m]))* on(instance) group_left(nodename) (node_uname_info)
      record: node_exporter:network:netout:packet:rate
      labels:
        desc: "节点网卡发送的数据包个数"
        unit: "个/秒"
        job: "auto_discovery_dns"

    - expr: avg by (environment,instance,device) (irate(node_network_receive_errs_total{device=~"eth0|eth1|ens33|ens37"}[1m]))* on(instance) group_left(nodename) (node_uname_info)
      record: node_exporter:network:netin:error:rate
      labels:
        desc: "节点设备驱动器检测到的接收错误包的数量"
        unit: "个/秒"
        job: "auto_discovery_dns"

    - expr: avg by (environment,instance,device) (irate(node_network_transmit_errs_total{device=~"eth0|eth1|ens33|ens37"}[1m]))* on(instance) group_left(nodename) (node_uname_info)
      record: node_exporter:network:netout:error:rate
      labels:
        desc: "节点设备驱动器检测到的发送错误包的数量"
        unit: "个/秒"
        job: "auto_discovery_dns"

    - expr: node_tcp_connection_states{job="auto_discovery_dns", state="established"}* on(instance) group_left(nodename) (node_uname_info)
      record: node_exporter:network:tcp:established:count
      labels:
        desc: "节点当前established的个数"
        unit: "个"
        job: "auto_discovery_dns"

    - expr: node_tcp_connection_states{job="auto_discovery_dns", state="time_wait"}* on(instance) group_left(nodename) (node_uname_info)
      record: node_exporter:network:tcp:timewait:count
      labels:
        desc: "节点timewait的连接数"
        unit: "个"
        job: "auto_discovery_dns"

    - expr: sum by (environment,instance) (node_tcp_connection_states{job="auto_discovery_dns"})* on(instance) group_left(nodename) (node_uname_info)
      record: node_exporter:network:tcp:total:count
      labels:
        desc: "节点tcp连接总数"
        unit: "个"
        job: "auto_discovery_dns"
#############################################################################################
#                                process                                                    #
    - expr: node_processes_state{state="Z"}* on(instance) group_left(nodename) (node_uname_info)
      record: node_exporter:process:zoom:total:count
      labels:
        desc: "节点当前状态为zoom的个数"
        unit: "个"
        job: "auto_discovery_dns"
#############################################################################################
#                                other                                                    #
    - expr: abs(node_timex_offset_seconds{job="auto_discovery_dns"})* on(instance) group_left(nodename) (node_uname_info)
      record: node_exporter:time:offset
      labels:
        desc: "节点的时间偏差"
        unit: "s"
        job: "auto_discovery_dns"
#############################################################################################
#
    - expr: count by (instance) ( count by (instance,cpu) (node_cpu_seconds_total{ mode='system'}) ) * on(instance) group_left(nodename) (node_uname_info)
      record: node_exporter:cpu:count
容器监控指标规则
/export/docker-data-proms/conf/rules/dockersInfo-record-rules.yml
groups:
  - name: dockersInfo-record
    rules:
    - expr: count by (instance, name) (count_over_time(container_last_seen{job="auto_discovery_dns", name!="", container_label_restartcount!=""}[15m]))
      record: dockersInfo:container:restart
      labels:
        desc: "15m周期内容器发生重启的次数"
        unit: ""
        job: "auto_discovery_dns"
##############################################################################################
#                              cpu                                                           #
    - expr: rate(container_cpu_usage_seconds_total{job="auto_discovery_dns", name!=''}[5m])  * 100
      record: dockersInfo:container:cpu:total:percent
      labels:
        desc: "容器的cpu总消耗百分比"
        unit: "%"
        job: "auto_discovery_dns"

    - expr: rate(container_fs_io_time_seconds_total{job="auto_discovery_dns", name!=''}[5m])  * 100
      record: dockersInfo:cpu:iowait:percent
      labels:
        desc: "容器的cpu iowait百分比"
        unit: "%"
        job: "auto_discovery_dns"

##############################################################################################
#                                    memory                                                  #
    - expr: container_spec_memory_limit_bytes{job="auto_discovery_dns", name!=''}
      record: dockersInfo:memory:total
      labels:
        desc: "容器的内存总量"
        unit: byte
        job: "auto_discovery_dns"

    - expr: container_memory_usage_bytes{job="auto_discovery_dns", name!=''} / container_spec_memory_limit_bytes{job="auto_discovery_dns", name!=''} * 100
      record: dockersInfo:memory:used:percent
      labels:
        desc: "容器的内存使用百分比"
        unit: "%"
        job: "auto_discovery_dns"
定义监控指标阈值规则
主机监控指标阈值
/export/docker-data-proms/conf/rules/node-exporter-alert-rules.yml
# node-exporter-alert-rules.yml
# 定义告警规则
# 通过前一个 rules 文件拿到定义的 record 别名来编写 expr 判断式
# 这里定义的告警规则,在触发的时候,都会传递到 alertmanager,最后从传递的信息中抽取所需数据发送给目标人。
groups:
- name: node-alert
rules:
- alert: node-down
expr: node_exporter:up == 0
for: 1m
labels:
severity: critical
annotations:
summary: "instance: {{ $labels.instance }} 宕机了"
grafana: "http://jksgg.pengwin.com:3000/d/9CWBz0bik/node-exporter?orgId=1&var-instance={{ $labels.instance }} "
console: "https://ecs.console.aliyun.com/#/server/{{ $labels.instanceid }}/detail?regionId=cn-beijing"
cloudmonitor: "https://cloudmonitor.console.aliyun.com/#/hostDetail/chart/instanceId={{ $labels.instanceid }}&system=®ion=cn-beijing&aliyunhost=true"
id: "{{ $labels.instanceid }}"
type: "aliyun_meta_ecs_info"
- alert: node-cpu-high
expr: node_exporter:cpu:total:percent > 80
for: 3m
labels:
severity: info
annotations:
summary: "instance: {{ $labels.instance }} cpu 使用率高于 {{ $value }}{{ $labels.unit }}"
grafana: "http://jksgg.pengwin.com:3000/d/9CWBz0bik/node-exporter?orgId=1&var-instance={{ $labels.instance }} "
console: "https://ecs.console.aliyun.com/#/server/{{ $labels.instanceid }}/detail?regionId=cn-beijing"
cloudmonitor: "https://cloudmonitor.console.aliyun.com/#/hostDetail/chart/instanceId={{ $labels.instanceid }}&system=®ion=cn-beijing&aliyunhost=true"
id: "{{ $labels.instanceid }}"
type: "aliyun_meta_ecs_info"
- alert: node-cpu-iowait-high
expr: node_exporter:cpu:iowait:percent >= 12
for: 3m
labels:
severity: info
annotations:
summary: "instance: {{ $labels.instance }} cpu iowait 使用率高于 {{ $value }}{{ $labels.unit }}"
grafana: "http://jksgg.pengwin.com:3000/d/9CWBz0bik/node-exporter?orgId=1&var-instance={{ $labels.instance }} "
console: "https://ecs.console.aliyun.com/#/server/{{ $labels.instanceid }}/detail?regionId=cn-beijing"
cloudmonitor: "https://cloudmonitor.console.aliyun.com/#/hostDetail/chart/instanceId={{ $labels.instanceid }}&system=®ion=cn-beijing&aliyunhost=true"
id: "{{ $labels.instanceid }}"
type: "aliyun_meta_ecs_info"
- alert: node-load-load1-high
expr: (node_exporter:load:load1) > (node_exporter:cpu:count) * 1.2
for: 3m
labels:
severity: info
annotations:
summary: "instance: {{ $labels.instance }} load1 使用率高于 {{ $value }}{{ $labels.unit }}"
grafana: "http://jksgg.pengwin.com:3000/d/9CWBz0bik/node-exporter?orgId=1&var-instance={{ $labels.instance }} "
console: "https://ecs.console.aliyun.com/#/server/{{ $labels.instanceid }}/detail?regionId=cn-beijing"
cloudmonitor: "https://cloudmonitor.console.aliyun.com/#/hostDetail/chart/instanceId={{ $labels.instanceid }}&system=®ion=cn-beijing&aliyunhost=true"
id: "{{ $labels.instanceid }}"
type: "aliyun_meta_ecs_info"
- alert: node-memory-high
expr: node_exporter:memory:used:percent > 85
for: 3m
labels:
severity: info
annotations:
summary: "内存使用率高于 {{ $value }}{{ $labels.unit }}"
grafana: "http://jksgg.pengwin.com:3000/d/9CWBz0bik/node-exporter?orgId=1&var-instance={{ $labels.instance }} "
console: "https://ecs.console.aliyun.com/#/server/{{ $labels.instanceid }}/detail?regionId=cn-beijing"
cloudmonitor: "https://cloudmonitor.console.aliyun.com/#/hostDetail/chart/instanceId={{ $labels.instanceid }}&system=®ion=cn-beijing&aliyunhost=true"
id: "{{ $labels.instanceid }}"
type: "aliyun_meta_ecs_info"
- alert: node-disk-high
expr: node_exporter:disk:used:percent > 80
for: 3m
labels:
severity: info
annotations:
summary: "{{ $labels.device }}:{{ $labels.mountpoint }} 使用率高于 {{ $value }}{{ $labels.unit }}"
grafana: "http://jksgg.pengwin.com:3000/d/9CWBz0bik/node-exporter?orgId=1&var-instance={{ $labels.instance }} "
console: "https://ecs.console.aliyun.com/#/server/{{ $labels.instanceid }}/detail?regionId=cn-beijing"
cloudmonitor: "https://cloudmonitor.console.aliyun.com/#/hostDetail/chart/instanceId={{ $labels.instanceid }}&system=®ion=cn-beijing&aliyunhost=true"
id: "{{ $labels.instanceid }}"
type: "aliyun_meta_ecs_info"
- alert: node-disk-read:count-high
expr: node_exporter:disk:read:count:rate > 3000
for: 2m
labels:
severity: info
annotations:
summary: "instance: {{ $labels.instance }} iops read 使用率高于 {{ $value }}{{ $labels.unit }}"
grafana: "http://jksgg.pengwin.com:3000/d/9CWBz0bik/node-exporter?orgId=1&var-instance={{ $labels.instance }} "
console: "https://ecs.console.aliyun.com/#/server/{{ $labels.instanceid }}/detail?regionId=cn-beijing"
cloudmonitor: "https://cloudmonitor.console.aliyun.com/#/hostDetail/chart/instanceId={{ $labels.instanceid }}&system=®ion=cn-beijing&aliyunhost=true"
id: "{{ $labels.instanceid }}"
type: "aliyun_meta_ecs_info"
- alert: node-disk-write-count-high
expr: node_exporter:disk:write:count:rate > 3000
for: 2m
labels:
severity: info
annotations:
summary: "instance: {{ $labels.instance }} iops write 使用率高于 {{ $value }}{{ $labels.unit }}"
grafana: "http://jksgg.pengwin.com:3000/d/9CWBz0bik/node-exporter?orgId=1&var-instance={{ $labels.instance }} "
console: "https://ecs.console.aliyun.com/#/server/{{ $labels.instanceid }}/detail?regionId=cn-beijing"
cloudmonitor: "https://cloudmonitor.console.aliyun.com/#/hostDetail/chart/instanceId={{ $labels.instanceid }}&system=®ion=cn-beijing&aliyunhost=true"
id: "{{ $labels.instanceid }}"
type: "aliyun_meta_ecs_info"
- alert: node-disk-read-mb-high
expr: node_exporter:disk:read:mb:rate > 60
for: 2m
labels:
severity: info
annotations:
summary: "instance: {{ $labels.instance }} 读取字节数 高于 {{ $value }}{{ $labels.unit }}"
grafana: "http://jksgg.pengwin.com:3000/d/9CWBz0bik/node-exporter?orgId=1&var-instance={{ $labels.instance }} "
console: "https://ecs.console.aliyun.com/#/server/{{ $labels.instanceid }}/detail?regionId=cn-beijing"
cloudmonitor: "https://cloudmonitor.console.aliyun.com/#/hostDetail/chart/instanceId={{ $labels.instanceid }}&system=®ion=cn-beijing&aliyunhost=true"
id: "{{ $labels.instanceid }}"
type: "aliyun_meta_ecs_info"
- alert: node-disk-write-mb-high
expr: node_exporter:disk:write:mb:rate > 60
for: 2m
labels:
severity: info
annotations:
summary: "instance: {{ $labels.instance }} 写入字节数 高于 {{ $value }}{{ $labels.unit }}"
grafana: "http://jksgg.pengwin.com:3000/d/9CWBz0bik/node-exporter?orgId=1&var-instance={{ $labels.instance }} "
console: "https://ecs.console.aliyun.com/#/server/{{ $labels.instanceid }}/detail?regionId=cn-beijing"
cloudmonitor: "https://cloudmonitor.console.aliyun.com/#/hostDetail/chart/instanceId={{ $labels.instanceid }}&system=®ion=cn-beijing&aliyunhost=true"
id: "{{ $labels.instanceid }}"
type: "aliyun_meta_ecs_info"
- alert: node-filefd-allocated-percent-high
expr: node_exporter:filefd_allocated:percent > 80
for: 10m
labels:
severity: info
annotations:
summary: "instance: {{ $labels.instance }} 打开文件描述符 高于 {{ $value }}{{ $labels.unit }}"
grafana: "http://jksgg.pengwin.com:3000/d/9CWBz0bik/node-exporter?orgId=1&var-instance={{ $labels.instance }} "
console: "https://ecs.console.aliyun.com/#/server/{{ $labels.instanceid }}/detail?regionId=cn-beijing"
cloudmonitor: "https://cloudmonitor.console.aliyun.com/#/hostDetail/chart/instanceId={{ $labels.instanceid }}&system=®ion=cn-beijing&aliyunhost=true"
id: "{{ $labels.instanceid }}"
type: "aliyun_meta_ecs_info"
- alert: node-network-netin-error-rate-high
expr: node_exporter:network:netin:error:rate > 4
for: 1m
labels:
severity: info
annotations:
summary: "instance: {{ $labels.instance }} 包进入的错误速率 高于 {{ $value }}{{ $labels.unit }}"
grafana: "http://jksgg.pengwin.com:3000/d/9CWBz0bik/node-exporter?orgId=1&var-instance={{ $labels.instance }} "
console: "https://ecs.console.aliyun.com/#/server/{{ $labels.instanceid }}/detail?regionId=cn-beijing"
cloudmonitor: "https://cloudmonitor.console.aliyun.com/#/hostDetail/chart/instanceId={{ $labels.instanceid }}&system=®ion=cn-beijing&aliyunhost=true"
id: "{{ $labels.instanceid }}"
type: "aliyun_meta_ecs_info"
- alert: node-network-netin-packet-rate-high
expr: node_exporter:network:netin:packet:rate > 35000
for: 1m
labels:
severity: info
annotations:
summary: "instance: {{ $labels.instance }} 包进入速率 高于 {{ $value }}{{ $labels.unit }}"
grafana: "http://jksgg.pengwin.com:3000/d/9CWBz0bik/node-exporter?orgId=1&var-instance={{ $labels.instance }} "
console: "https://ecs.console.aliyun.com/#/server/{{ $labels.instanceid }}/detail?regionId=cn-beijing"
cloudmonitor: "https://cloudmonitor.console.aliyun.com/#/hostDetail/chart/instanceId={{ $labels.instanceid }}&system=®ion=cn-beijing&aliyunhost=true"
id: "{{ $labels.instanceid }}"
type: "aliyun_meta_ecs_info"
- alert: node-network-netout-packet-rate-high
expr: node_exporter:network:netout:packet:rate > 35000
for: 1m
labels:
severity: info
annotations:
summary: "instance: {{ $labels.instance }} 包流出速率 高于 {{ $value }}{{ $labels.unit }}"
grafana: "http://jksgg.pengwin.com:3000/d/9CWBz0bik/node-exporter?orgId=1&var-instance={{ $labels.instance }} "
console: "https://ecs.console.aliyun.com/#/server/{{ $labels.instanceid }}/detail?regionId=cn-beijing"
cloudmonitor: "https://cloudmonitor.console.aliyun.com/#/hostDetail/chart/instanceId={{ $labels.instanceid }}&system=®ion=cn-beijing&aliyunhost=true"
id: "{{ $labels.instanceid }}"
type: "aliyun_meta_ecs_info"
- alert: node-network-tcp-total-count-high
expr: node_exporter:network:tcp:total:count > 40000
for: 1m
labels:
severity: info
annotations:
summary: "instance: {{ $labels.instance }} tcp连接数量 高于 {{ $value }}{{ $labels.unit }}"
grafana: "http://jksgg.pengwin.com:3000/d/9CWBz0bik/node-exporter?orgId=1&var-instance={{ $labels.instance }} "
console: "https://ecs.console.aliyun.com/#/server/{{ $labels.instanceid }}/detail?regionId=cn-beijing"
cloudmonitor: "https://cloudmonitor.console.aliyun.com/#/hostDetail/chart/instanceId={{ $labels.instanceid }}&system=®ion=cn-beijing&aliyunhost=true"
id: "{{ $labels.instanceid }}"
type: "aliyun_meta_ecs_info"
- alert: node-process-zoom-total-count-high
expr: node_exporter:process:zoom:total:count > 10
for: 10m
labels:
severity: info
annotations:
summary: "instance: {{ $labels.instance }} 僵死进程数量 高于 {{ $value }}{{ $labels.unit }}"
grafana: "http://jksgg.pengwin.com:3000/d/9CWBz0bik/node-exporter?orgId=1&var-instance={{ $labels.instance }} "
console: "https://ecs.console.aliyun.com/#/server/{{ $labels.instanceid }}/detail?regionId=cn-beijing"
cloudmonitor: "https://cloudmonitor.console.aliyun.com/#/hostDetail/chart/instanceId={{ $labels.instanceid }}&system=®ion=cn-beijing&aliyunhost=true"
id: "{{ $labels.instanceid }}"
type: "aliyun_meta_ecs_info"
- alert: node-time-offset-high
expr: node_exporter:time:offset > 0.03
for: 2m
labels:
severity: info
annotations:
summary: "instance: {{ $labels.instance }} {{ $labels.desc }} {{ $value }}{{ $labels.unit }}"
grafana: "http://jksgg.pengwin.com:3000/d/9CWBz0bik/node-exporter?orgId=1&var-instance={{ $labels.instance }} "
console: "https://ecs.console.aliyun.com/#/server/{{ $labels.instanceid }}/detail?regionId=cn-beijing"
cloudmonitor: "https://cloudmonitor.console.aliyun.com/#/hostDetail/chart/instanceId={{ $labels.instanceid }}&system=®ion=cn-beijing&aliyunhost=true"
id: "{{ $labels.instanceid }}"
type: "aliyun_meta_ecs_info"
容器监控指标阈值
/export/docker-data-proms/conf/rules/dockersInfo-alert-rules.yml
groups:
- name: container-alert
rules:
- alert: container-restart-times-high
expr: dockersInfo:container:restart > 5
for: 1m
labels:
severity: warn
annotations:
summary: "instance: {{ $labels.instance }} 下的 container: {{ $labels.name }} 15分钟内重启次数超过5次"
grafana: "http://proms.pengwin.com:3000/d/Ss3q6hSZk/dockersinfo?orgId=1&var-node={{ $labels.instance }}"
console: "https://ecs.console.aliyun.com/#/server/{{ $labels.instanceid }}/detail?regionId=cn-beijing"
cloudmonitor: "https://cloudmonitor.console.aliyun.com/#/hostDetail/chart/instanceId={{ $labels.instanceid }}&system=®ion=cn-beijing&aliyunhost=true"
id: "{{ $labels.instanceid }}"
type: "aliyun_meta_ecs_info"
- alert: container-cpu-usage-high
expr: dockersInfo:container:cpu:total:percent > 90
for: 1m
labels:
severity: info
annotations:
summary: "instance: {{ $labels.instance }} 下的 container: {{ $labels.name }} cpu 使用率持续超过90%."
grafana: "http://proms.pengwin.com:3000/d/Ss3q6hSZk/dockersinfo?orgId=1&var-node={{ $labels.instance }}"
console: "https://ecs.console.aliyun.com/#/server/{{ $labels.instanceid }}/detail?regionId=cn-beijing"
cloudmonitor: "https://cloudmonitor.console.aliyun.com/#/hostDetail/chart/instanceId={{ $labels.instanceid }}&system=®ion=cn-beijing&aliyunhost=true"
id: "{{ $labels.instanceid }}"
type: "aliyun_meta_ecs_info"
- alert: container-cpu-iowait-high
expr: dockersInfo:cpu:iowait:percent > 10
for: 1m
labels:
severity: warn
annotations:
summary: "instance: {{ $labels.instance }} 下的 container: {{ $labels.name }} cpu iowait 持续超过10%"
grafana: "http://proms.pengwin.com:3000/d/Ss3q6hSZk/dockersinfo?orgId=1&var-node={{ $labels.instance }}"
console: "https://ecs.console.aliyun.com/#/server/{{ $labels.instanceid }}/detail?regionId=cn-beijing"
cloudmonitor: "https://cloudmonitor.console.aliyun.com/#/hostDetail/chart/instanceId={{ $labels.instanceid }}&system=®ion=cn-beijing&aliyunhost=true"
id: "{{ $labels.instanceid }}"
type: "aliyun_meta_ecs_info"
# - alert: container-mem-usage-high
# expr: dockersInfo:memory:used:percent > 80
# for: 1m
# labels:
# severity: warn
# annotations:
# summary: "instance: {{ $labels.instance }} 下的 container: {{ $labels.name }} 内存使用率超过80%"
# grafana: "http://proms.pengwin.com:3000/d/Ss3q6hSZk/dockersinfo?orgId=1&var-node={{ $labels.instance }}"
# console: "https://ecs.console.aliyun.com/#/server/{{ $labels.instanceid }}/detail?regionId=cn-beijing"
# cloudmonitor: "https://cloudmonitor.console.aliyun.com/#/hostDetail/chart/instanceId={{ $labels.instanceid }}&system=®ion=cn-beijing&aliyunhost=true"
# id: "{{ $labels.instanceid }}"
# type: "aliyun_meta_ecs_info"
告警流程解析
关于告警,prometheus存在三个告警状态:
- inactive 未触发expr告警表达式。
- pending 已触发 expr 告警表达式,但还未满足告警持续时间(即 for 语法关键词)。
- firing 已触发最新一次expr 告警表达式且满足告警持续时间。
http://ip:9090/alerts 可以看到各项告警规则的状态。
💥需要注意的是,如果不设置for或者将其置为0,则会跳过告警持续时间,直接告警。
借用网上的一个例子来介绍:
groups:
-  name: example
   rules:
   - alert: mysql_uptime
      expr: mysql:server_status:uptime < 30
      for: 10s
      labels:
         level: "CRITICAL"
      annotations:
         detail: 数据库运行时间

每5秒采集一个数据点;采集第三个点的时候,发现 mysql_uptime = 0; 说明 mysql 发生重启。
每10秒计算表达式 server_status:uptime < 30 是否为真;在第三个采集点与第四个采集点之间触发了一次计算,致使触发告警。
等待告警持续时间 10 秒,再次计算表达式 server_status:uptime < 30 是否为真。最终满足【已触发最新一次 expr 告警表达式且满足告警持续时间】,从而触发告警发送给Altertmanager告警管理器。
部署
docker 方式
docker run -d \
--name proms \
--network promsnet \
--restart always \
-p 9090:9090 \
--mount 'type=bind,src=/export/docker-data-proms/prometheus.yml,dst=/etc/prometheus/prometheus.yml'  \
--mount 'type=bind,src=/export/docker-data-proms/data,dst=/prometheus' \
--mount 'type=bind,src=/export/docker-data-proms/conf,dst=/etc/prometheus/conf' \
prom/prometheus \
--config.file=/etc/prometheus/prometheus.yml \
--storage.tsdb.path=/prometheus \
--storage.tsdb.retention=15d \
--web.enable-admin-api \
--web.enable-lifecycle
⚠️
--web.enable-admin-api 如果不开启,则无法使用api接口,也就无法自主的删除数据.
--web.enable-lifecycle如果不开启,则无法通过 curl -XPOST http://ip:9090/-/reload 重载 prometheus
二进制方式
wget https://github.com/prometheus/prometheus/releases/download/v2.20.0/prometheus-2.20.0.linux-amd64.tar.gz
mkdir prometheus
tar xf prometheus-2.20.0.linux-amd64.tar.gz --strip-components 1 -C prometheus
rm -rf prometheus-2.20.0.linux-amd64.tar.gz
cd prometheus && baseDir=`pwd`
cp prometheus.yml{,.bak}
#---
cat > /usr/lib/systemd/system/prometheus.service <<EOF
[Unit]
Description=prometheus server daemon

[Service]
Restart=on-failure
ExecStart=${baseDir}/prometheus --config.file=${baseDir}/prometheus.yml

[Install]
WantedBy=multi-user.target
EOF
#---
systemctl daemon-reload
systemctl start prometheus
查看
被监控端状态:http://xxx:9090/targets
通过上述地址,你可以看到配置中 job_name 定义的被监控任务的端点状态
数据删除
# match[] 表示匹配所有key, {}精确选中key
# 删除包含{instance="10.3.128.202:15692"}的所有数据
curl -X POST -g 'http://127.0.0.1:9090/api/v1/admin/tsdb/delete_series?match[]={instance=~"10.3.128.202:15692"}'
# 添加删除时间范围
curl -X POST -g 'http://127.0.0.1:9090/api/v1/admin/tsdb/delete_series?start=2021-05-30T00:00:00Z&end=2021-06-07T23:59:59Z'
pushgateway (未验证)
push 模式下的网关
当前没有现成的推送模式的 node-exporter
# docker
docker run -d --name=pushgateway -p 9091:9091 prom/pushgateway
# 一个推送模式的采集脚本示例
# cat tcpestab.sh

#!/bin/bash
# 添加脚本到计划任务中,定时采集
# pushgateway ip
pushgatewayIp=
#获取主机名,常传输到Prometheus标签以主机名
instance_name=`hostname -f | cut -d'.' -f1`
#判断主机名不能是localhost不然发送过的数据不知道是那个主机的
if [ $instance_name == "localhost" ];then
echo "Hostname must not localhost"
exit 1
fi
#自定义key,在Prometheus即可使用key查询
label="count_estab_connections"
#获取TCP estab 连接数
count_estab_connections=`netstat -an | grep -i 'established' | wc -l`
#将数据发送到pushgateway固定格式
echo "$label $count_estab_connections"  | curl --data-binary @- http://$pushgatewayIp:9091/metrics/job/pushgateway/instance/$instance_name
被监控端组件
prometheus官方列出的表单:
https://prometheus.io/docs/instrumenting/exporters/
编写exporter:
https://prometheus.io/docs/instrumenting/writing_exporters/
node-exporter 物理节点监控组件
宿主数据采集端,部署在被监控主机的9100端口
docker 不太建议
docker run -d \
  --name=node-exporter \
  --restart=always \
  --net="host" \
  --pid="host" \
  -v "/:/host:ro,rslave" \
  quay.io/prometheus/node-exporter:latest \
  --path.rootfs=/host
yum 方式 推荐
# yum包 https://copr.fedorainfracloud.org/coprs/ibotty/prometheus-exporters/
curl -Lo /etc/yum.repos.d/_copr_ibotty-prometheus-exporters.repo https://copr.fedorainfracloud.org/coprs/ibotty/prometheus-exporters/repo/epel-7/ibotty-prometheus-exporters-epel-7.repo && yum install node_exporter -y
源码包
cd /usr/local/
wget https://github.com/prometheus/node_exporter/releases/download/v1.0.1/node_exporter-1.0.1.linux-amd64.tar.gz
mkdir node_exporter
tar xf node_exporter-1.0.1.linux-amd64.tar.gz --strip-components 1 -C node_exporter
mv node_exporter-1.0.1.linux-amd64.tar.gz src
cd node_exporter && baseDir=`pwd`
#---
cat > /usr/lib/systemd/system/node_exporter.service <<EOF
[Unit]
Description=node_exporter server daemon

[Service]
Restart=on-failure
ExecStart=${baseDir}/node_exporter

[Install]
WantedBy=multi-user.target
EOF
yum和源码的启动方式
systemctl daemon-reload
systemctl start node_exporter
systemctl status node_exporter
curl http://localhost:9100/metrics # 查看获取的监控数据
systemctl enable node_exporter
cadvisor 容器监控组件
容器数据采集端,部署在被监控容器所在宿主的10052端口
dockerRoot=`docker info | awk -F':'  '/Docker Root Dir/{print $2}'|sed 's@^ *@@g'`
echo $dockerRoot
docker run \
  --restart=always \
  --volume=/:/rootfs:ro \
  --volume=/var/run:/var/run:rw \
  --volume=/sys:/sys:ro \
  --volume=${dockerRoot}/:/var/lib/docker:ro \
  --volume=/dev/disk/:/dev/disk:ro \
  --publish=10052:8080 \
  --privileged=true \
  --detach=true \
  --name=cadvisor \
  google/cadvisor:latest
使用
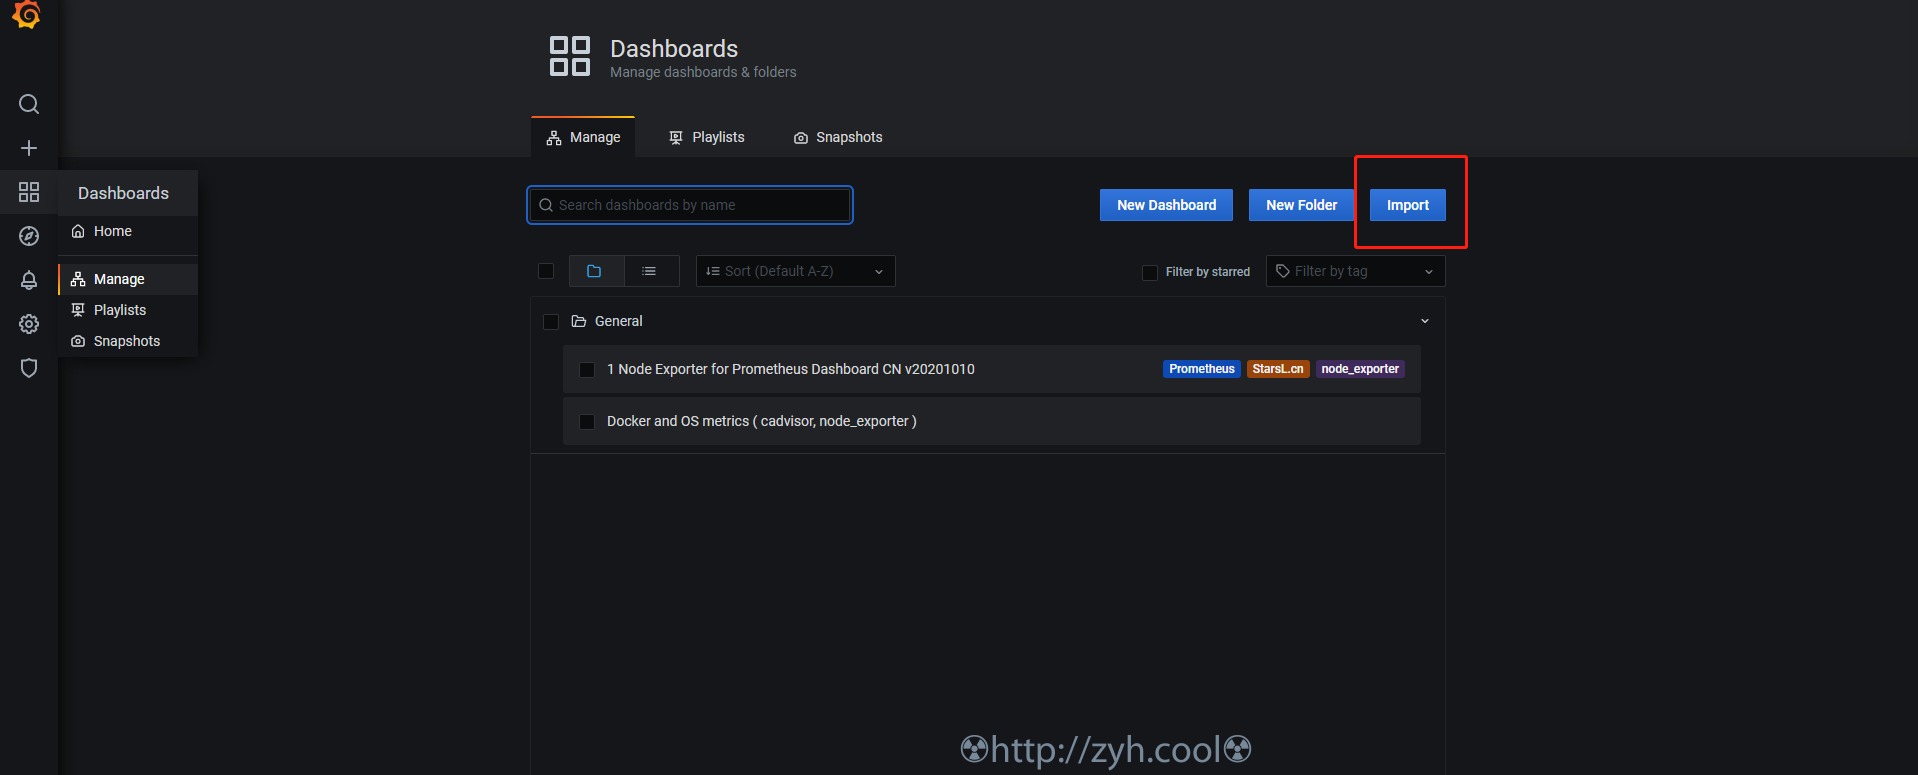
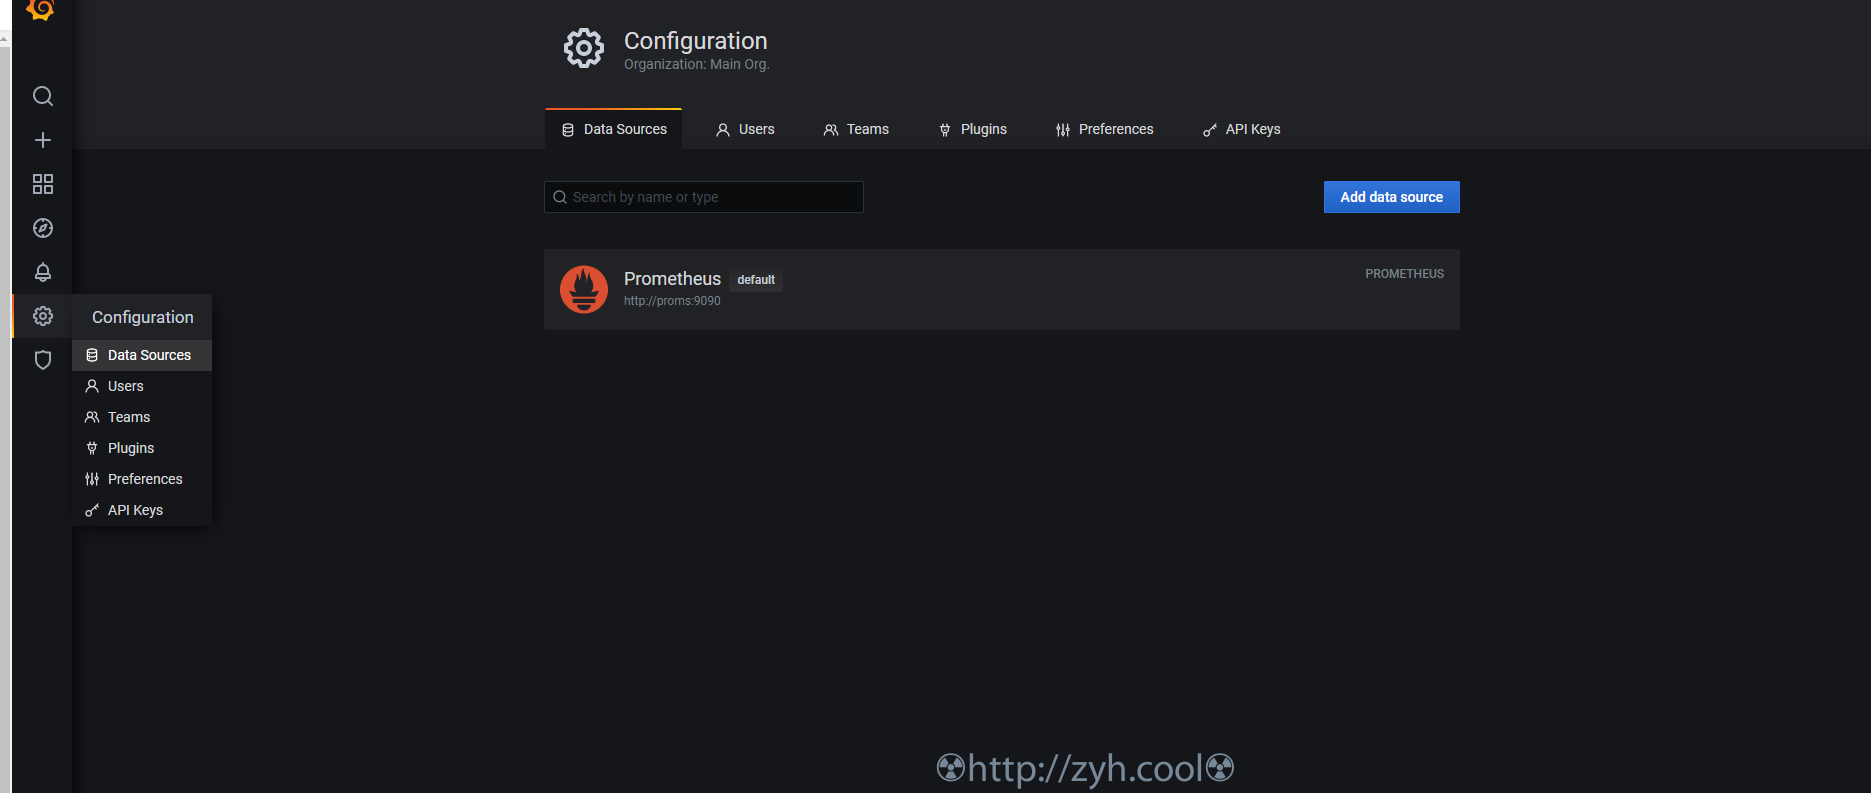
添加 grafana 数据源 : proms
添加 grafana 监控模板